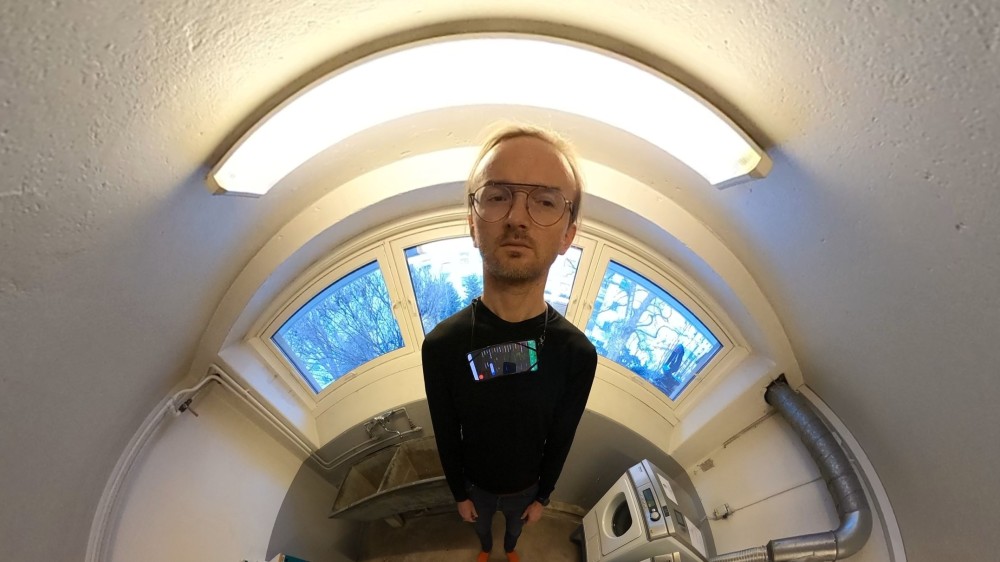
For my annual Still Standing project, I am recording 360 videos with audio and sensor data while standing still for 10 minutes.
I have started exploring how to visualize the sensor data best. Today, I am looking into visualization strategies for 360-degree images. I have written about how to pre-process 360-degree videos from Garmin VIRB and Ricoh Theta cameras previously.
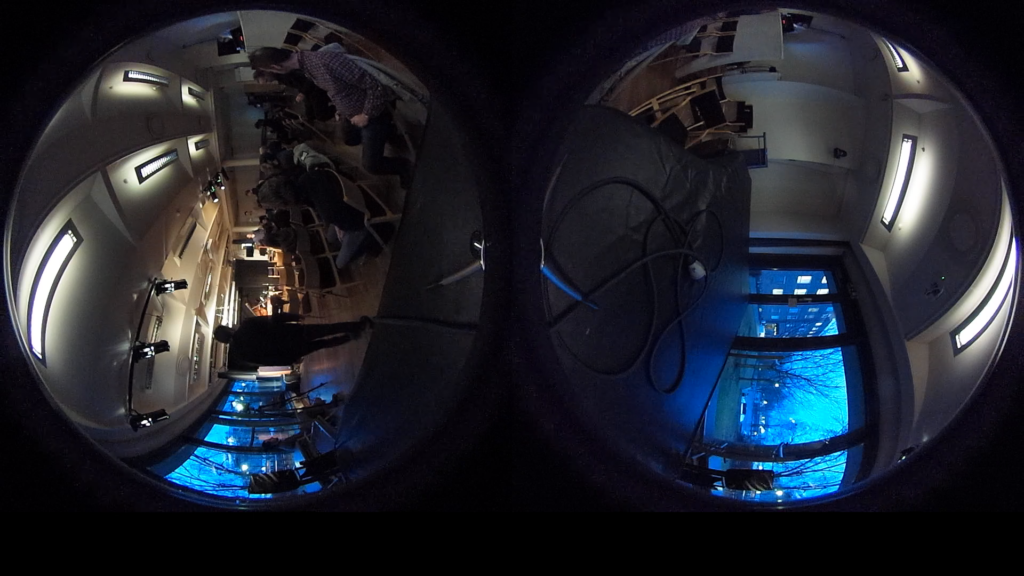
The Theta records in a dual fisheye format like this:
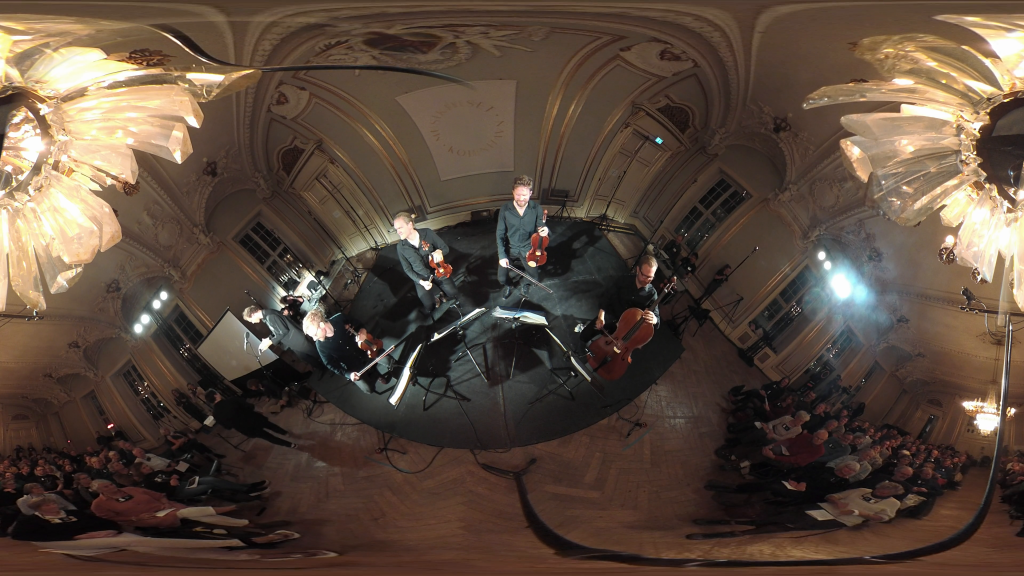
And the Garmin VIRB records in an equirectangular format like this:
The Theta and VIRB are quite old cameras, and the image quality cannot compare to the GoPro Max’s, particularly in low light conditions. So I have decided to use a GoPro for my new project.
Unfortunately, the GoPro records in an odd format to squeeze in as many pixels as possible. They are using what they called a stitched version of Google’s Equal Area Cubemap (EAC). This allows for recording more pixels, which is excellent. More problematic is that they do not have cross-platform software or open source code for converting the files (for example, with FFmpeg). So I need to rely on their mobile phone app and web interface.
In GoPro’s Quik web tool allows for playing around with different projections. These are both fun and illustrative, as can be seen in the examples below:
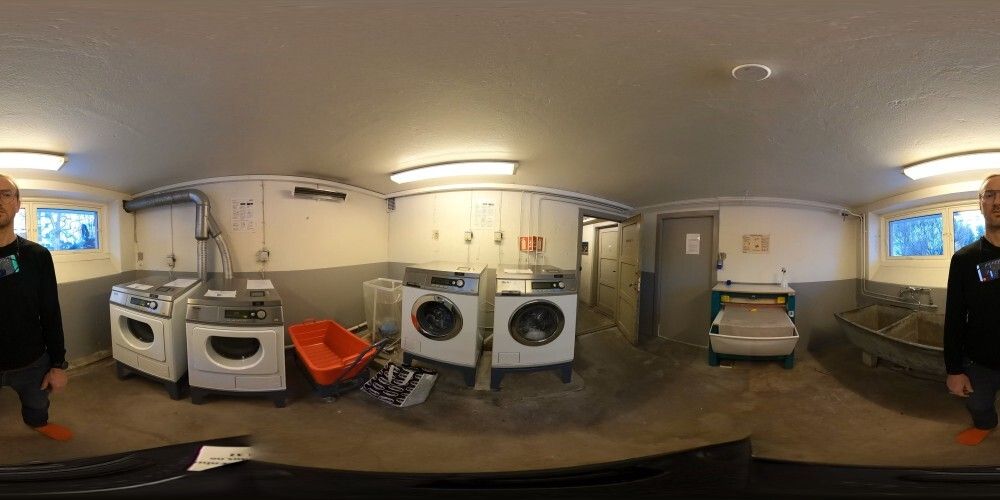
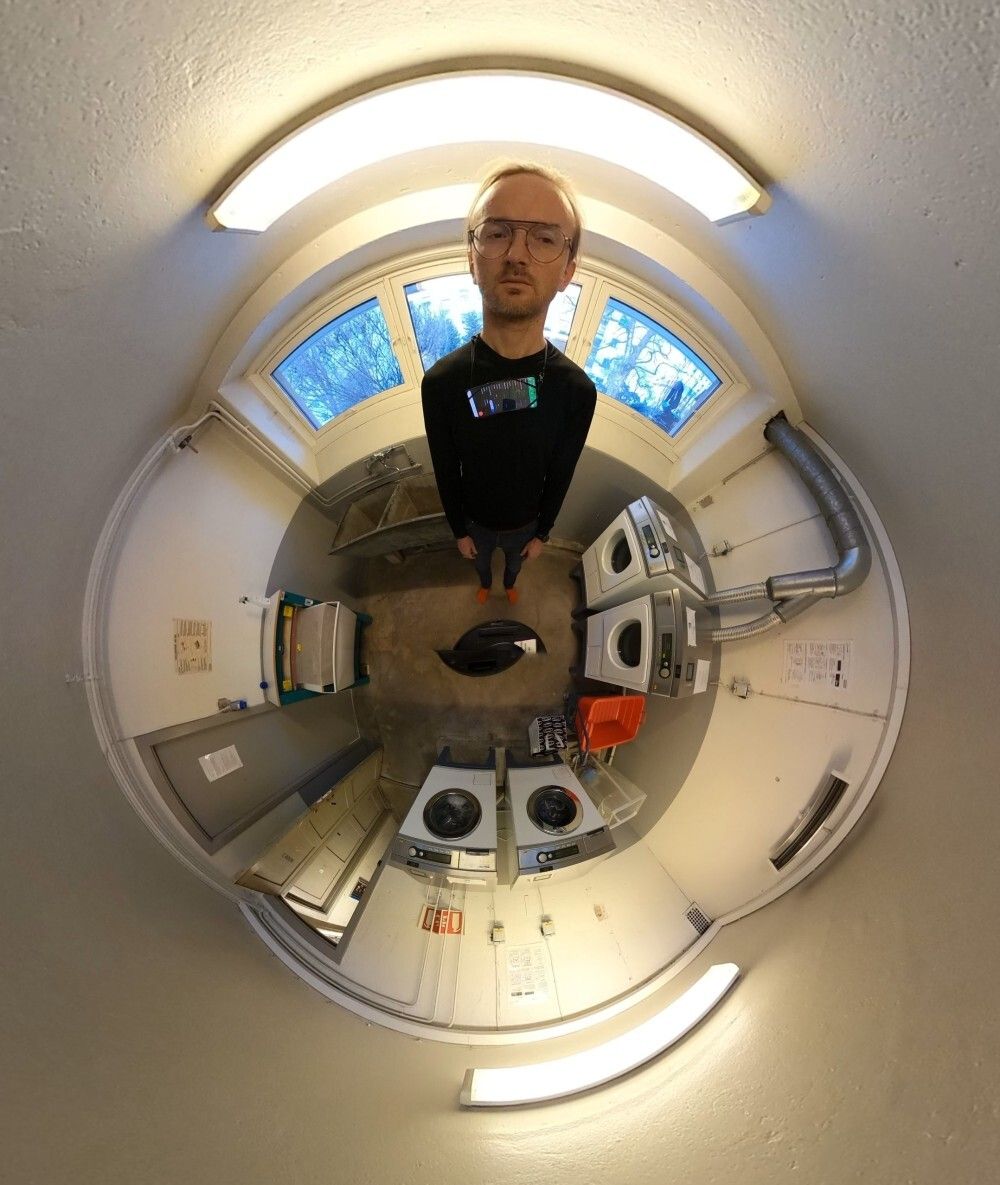
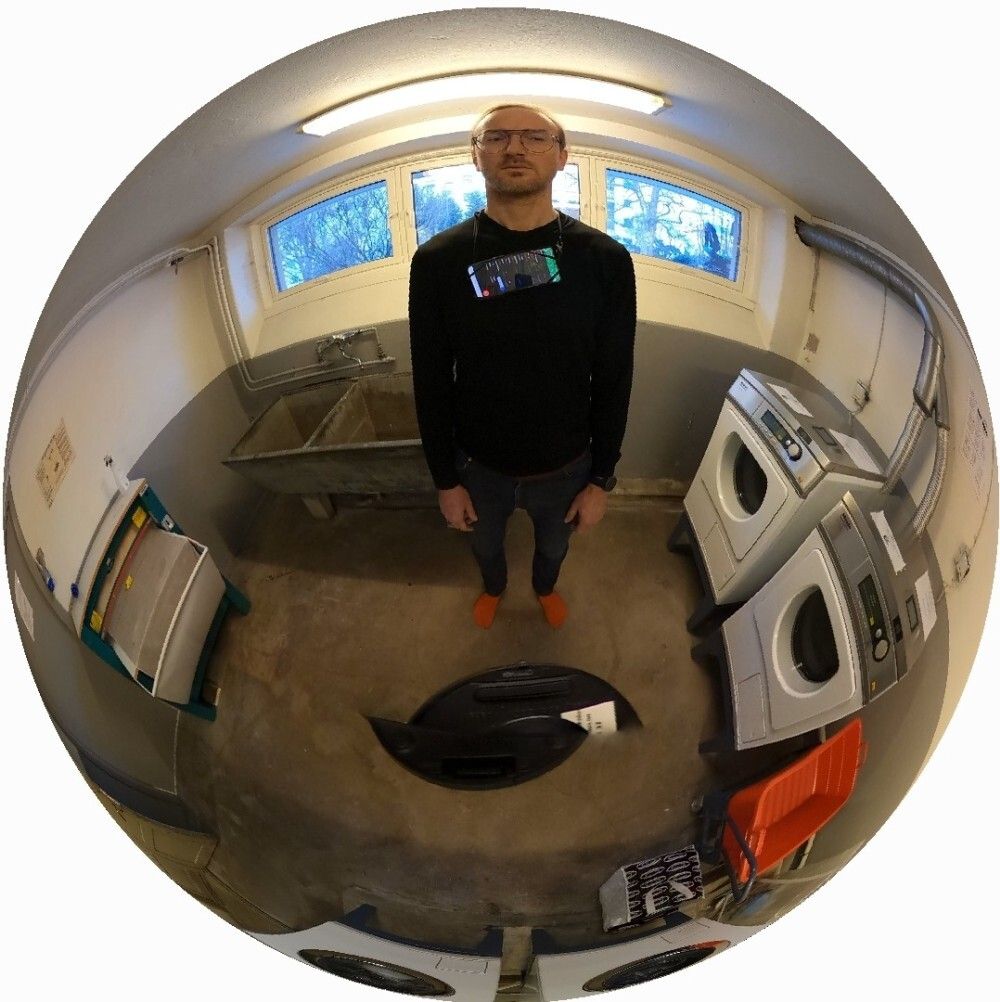
Unfortunately, I have not encountered any scripts that allow programmatically making such images. So I will have to make it myself at some point.
