I continue my testing of the new Musical Gestures Toolbox for Python. One thing is to use the toolbox on controlled recordings with stationary cameras and non-moving backgrounds (see examples of visualizations of AIST videos). But it is also interesting to explore “real world” videos (such as the Bergensbanen train journey).
I came across a great video of flamenco dancer Selene Muñoz, and wondered how I could visualize what is going on there:
Videograms and motiongrams
My first idea is always to create a motiongram to get an overview of what goes on in the video file. Here we can clearly see the structure of the recording:

The motiongram shows what changes in the frames. The challenge with analyzing such TV production recordings is that there is a lot of camera movement. This can be more clearly seen in a videogram (the same technique as motiongram, but calculated from the regular image).


Sometimes, the videogram can be useful, but the motiongram can more clearly show the motion happening in the files. Since it is based on frame differencing, it effectually “removes” the background material. So by zooming into a motiongram, it is possible to see more details of the motion.
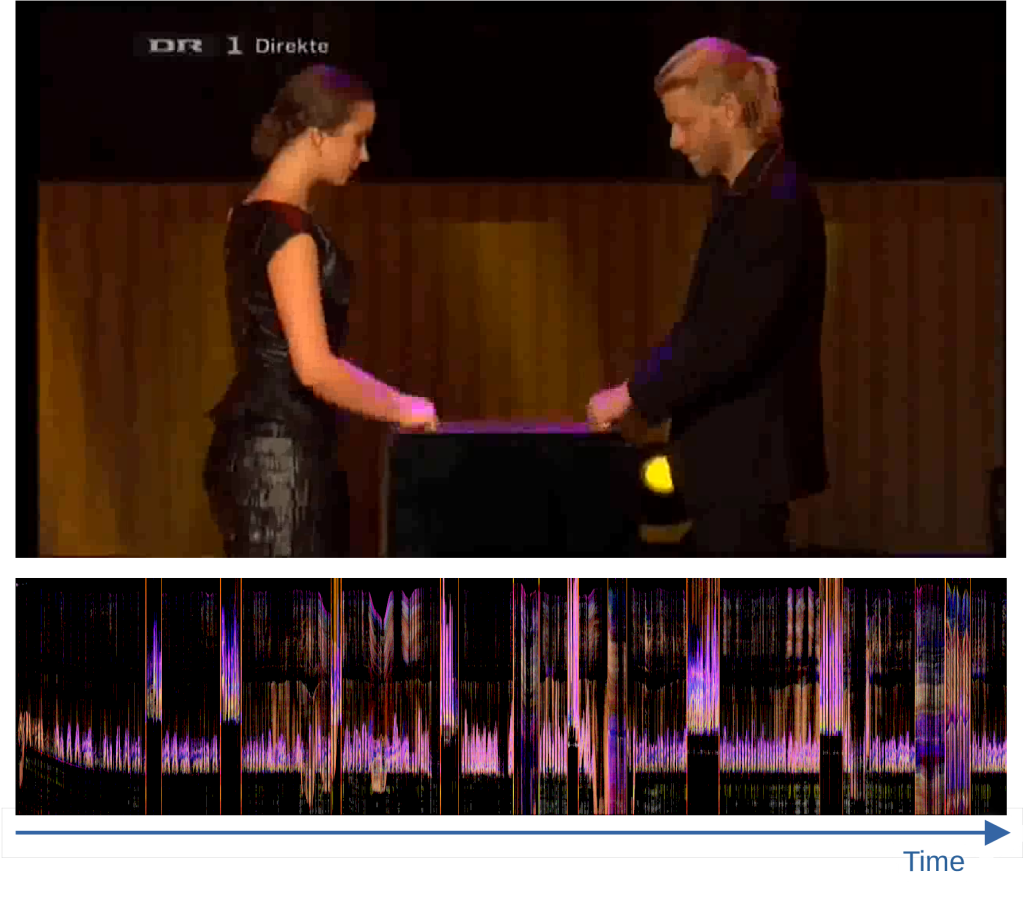
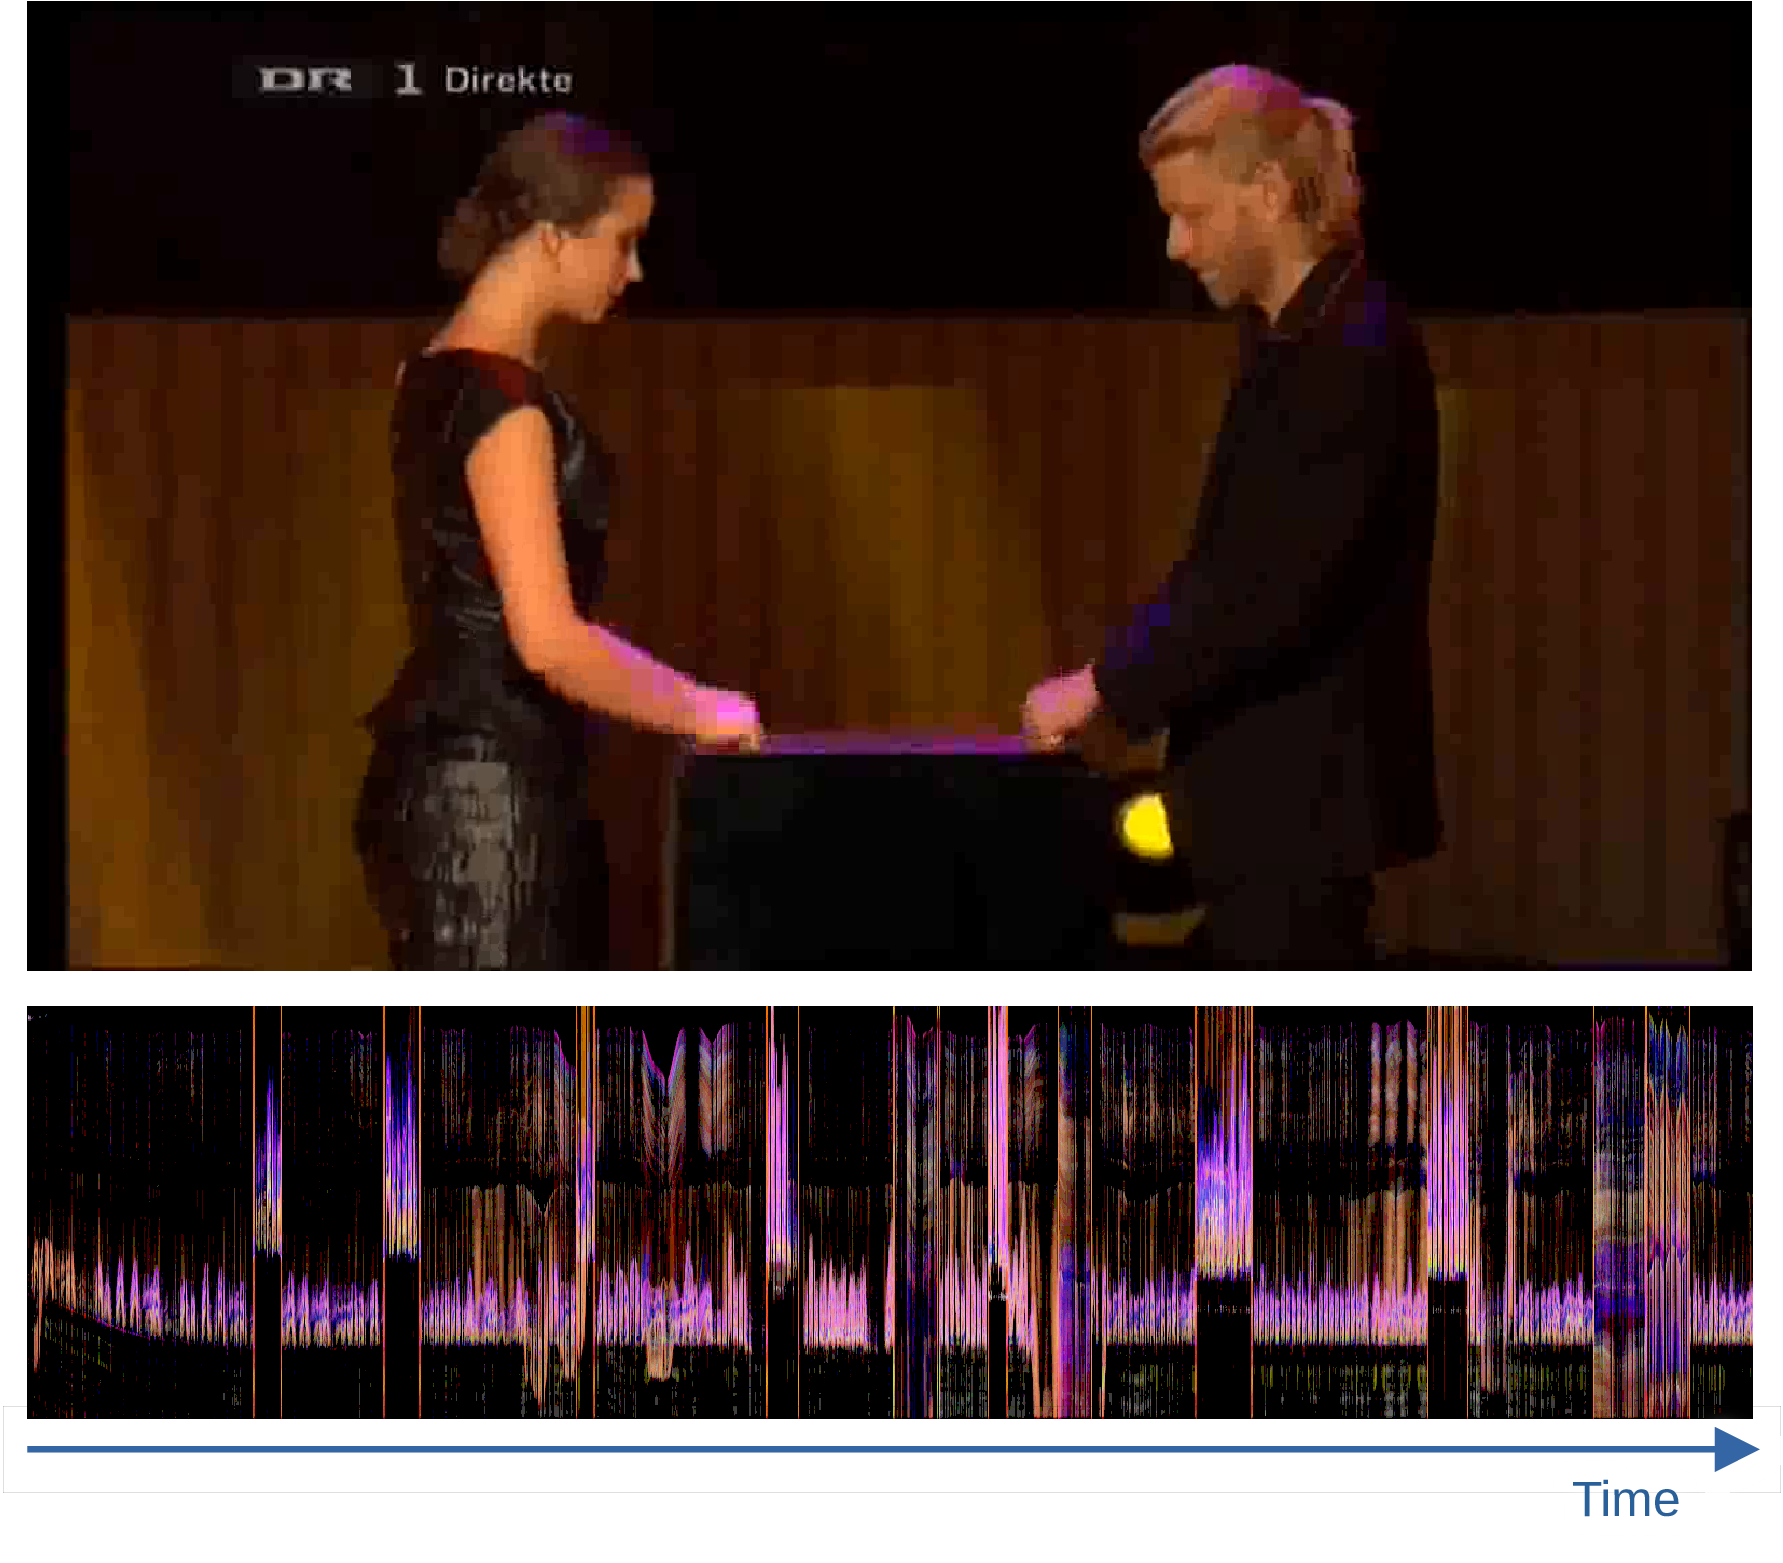
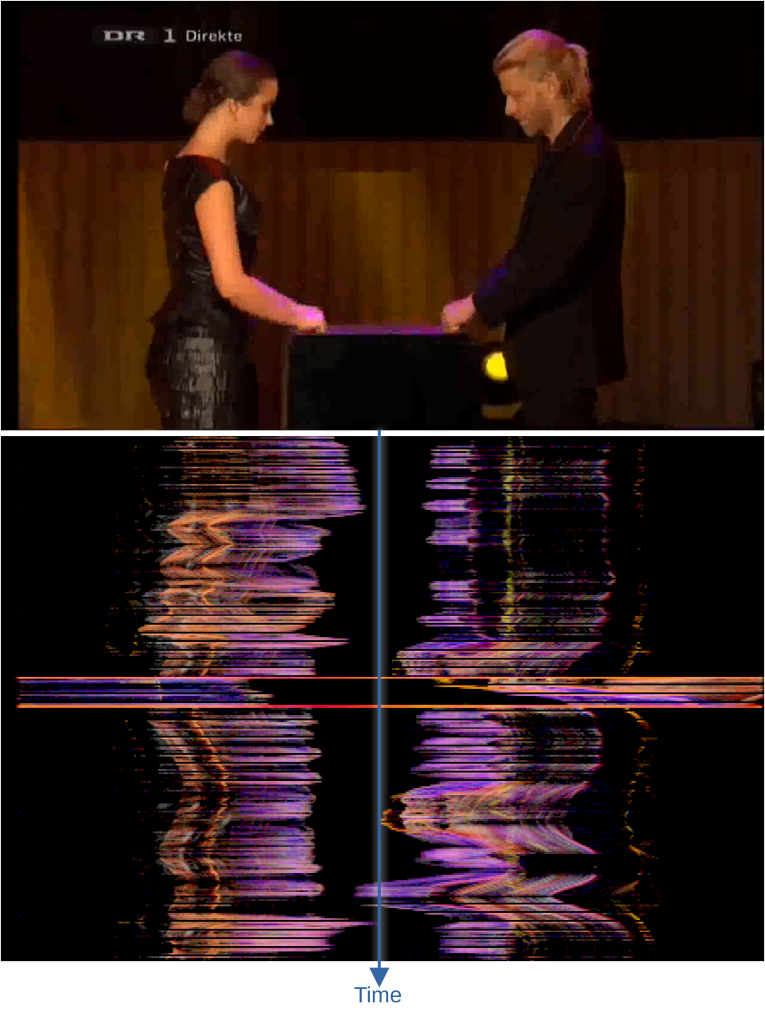
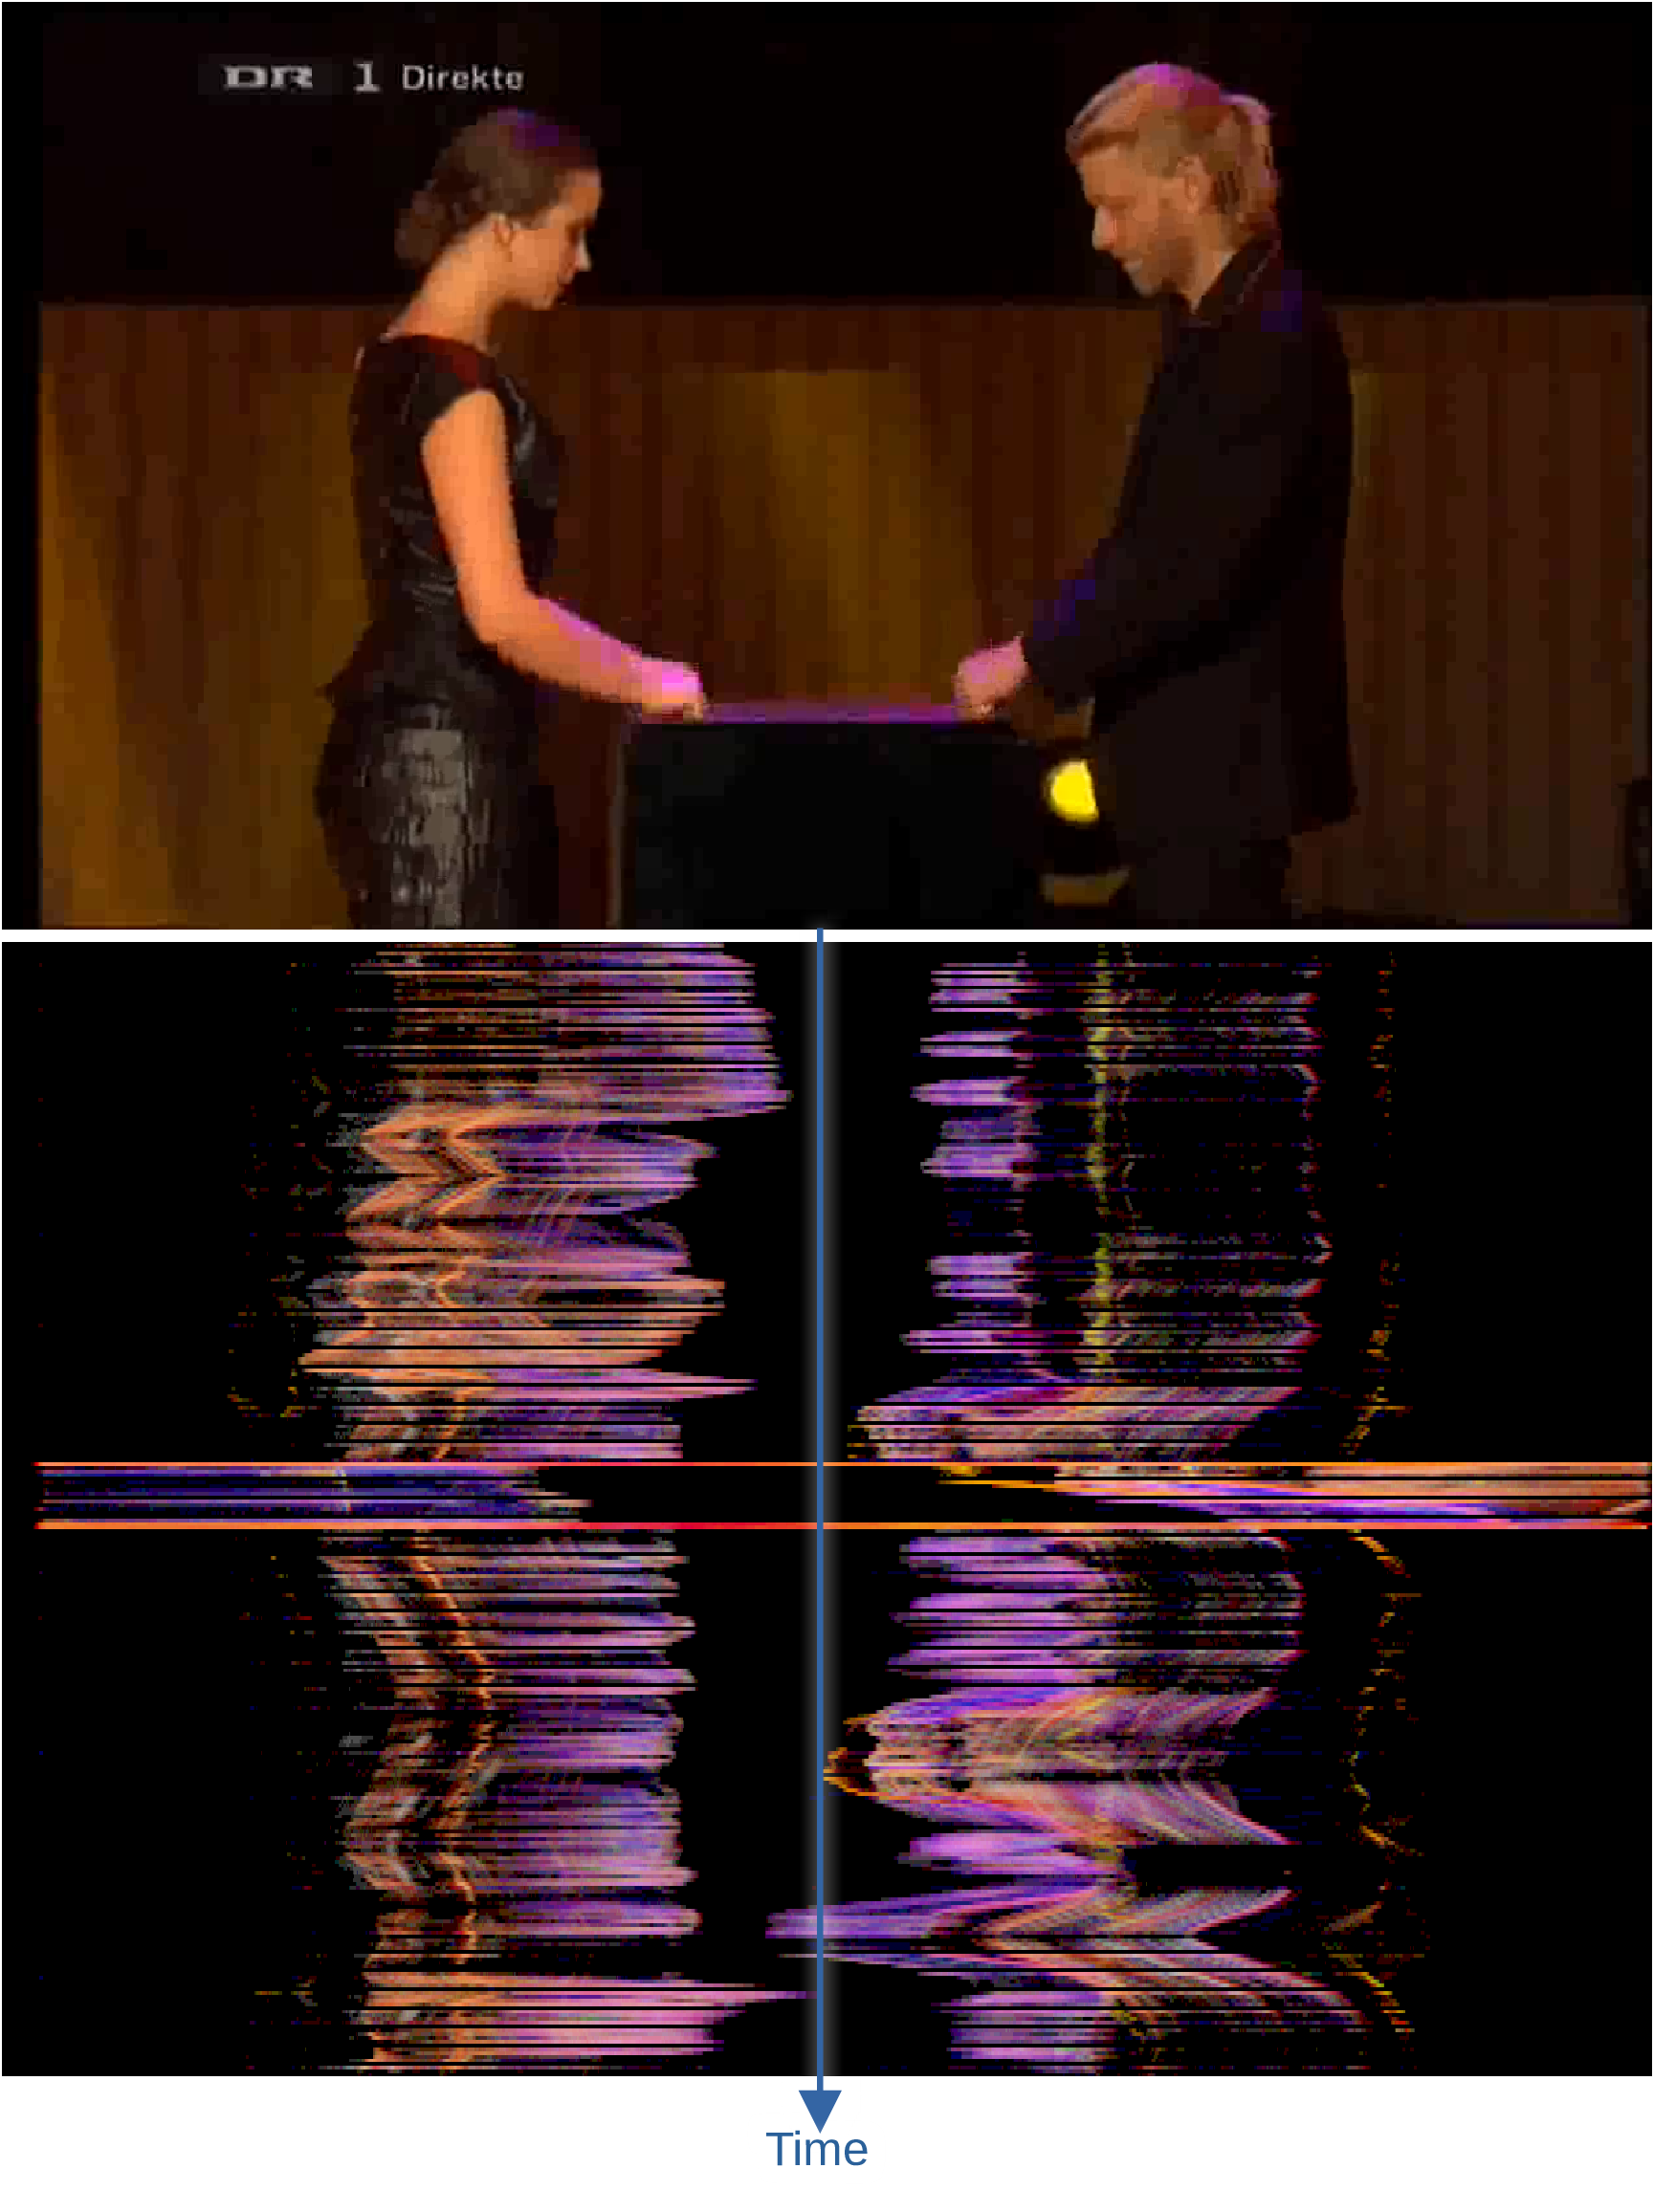
The above illustration shows a horizontal motiongram, which reflects the vertical motion (yes, it is a bit confusing with this horizontal/vertical thinking…). When there are two performers, that is not particularly useful. In such cases, I prefer to look at the vertical motiongram instead, which shows the horizontal motion. Then it is much easier to see the motion of each performer separately, not least their turn-taking in the performance.
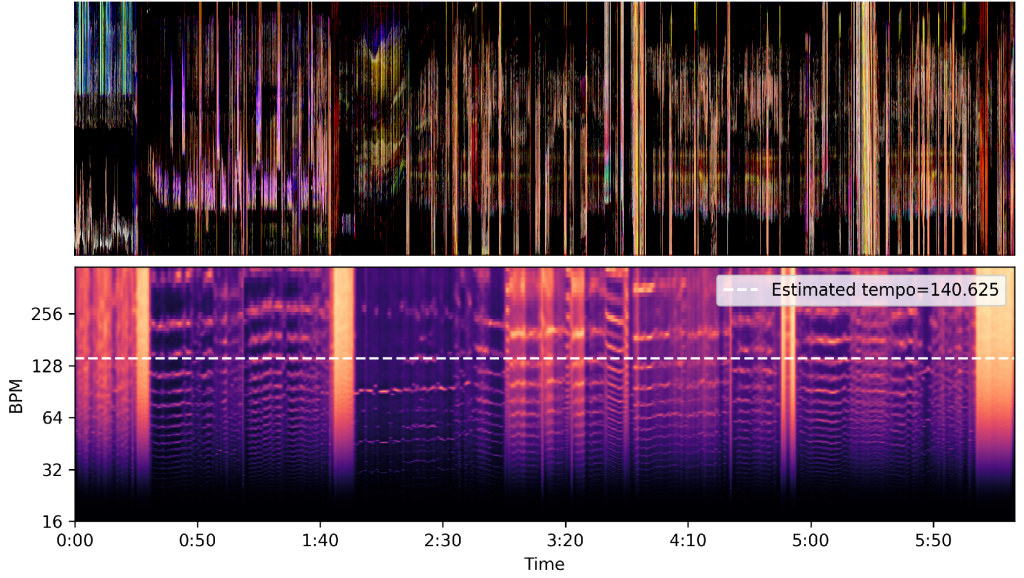
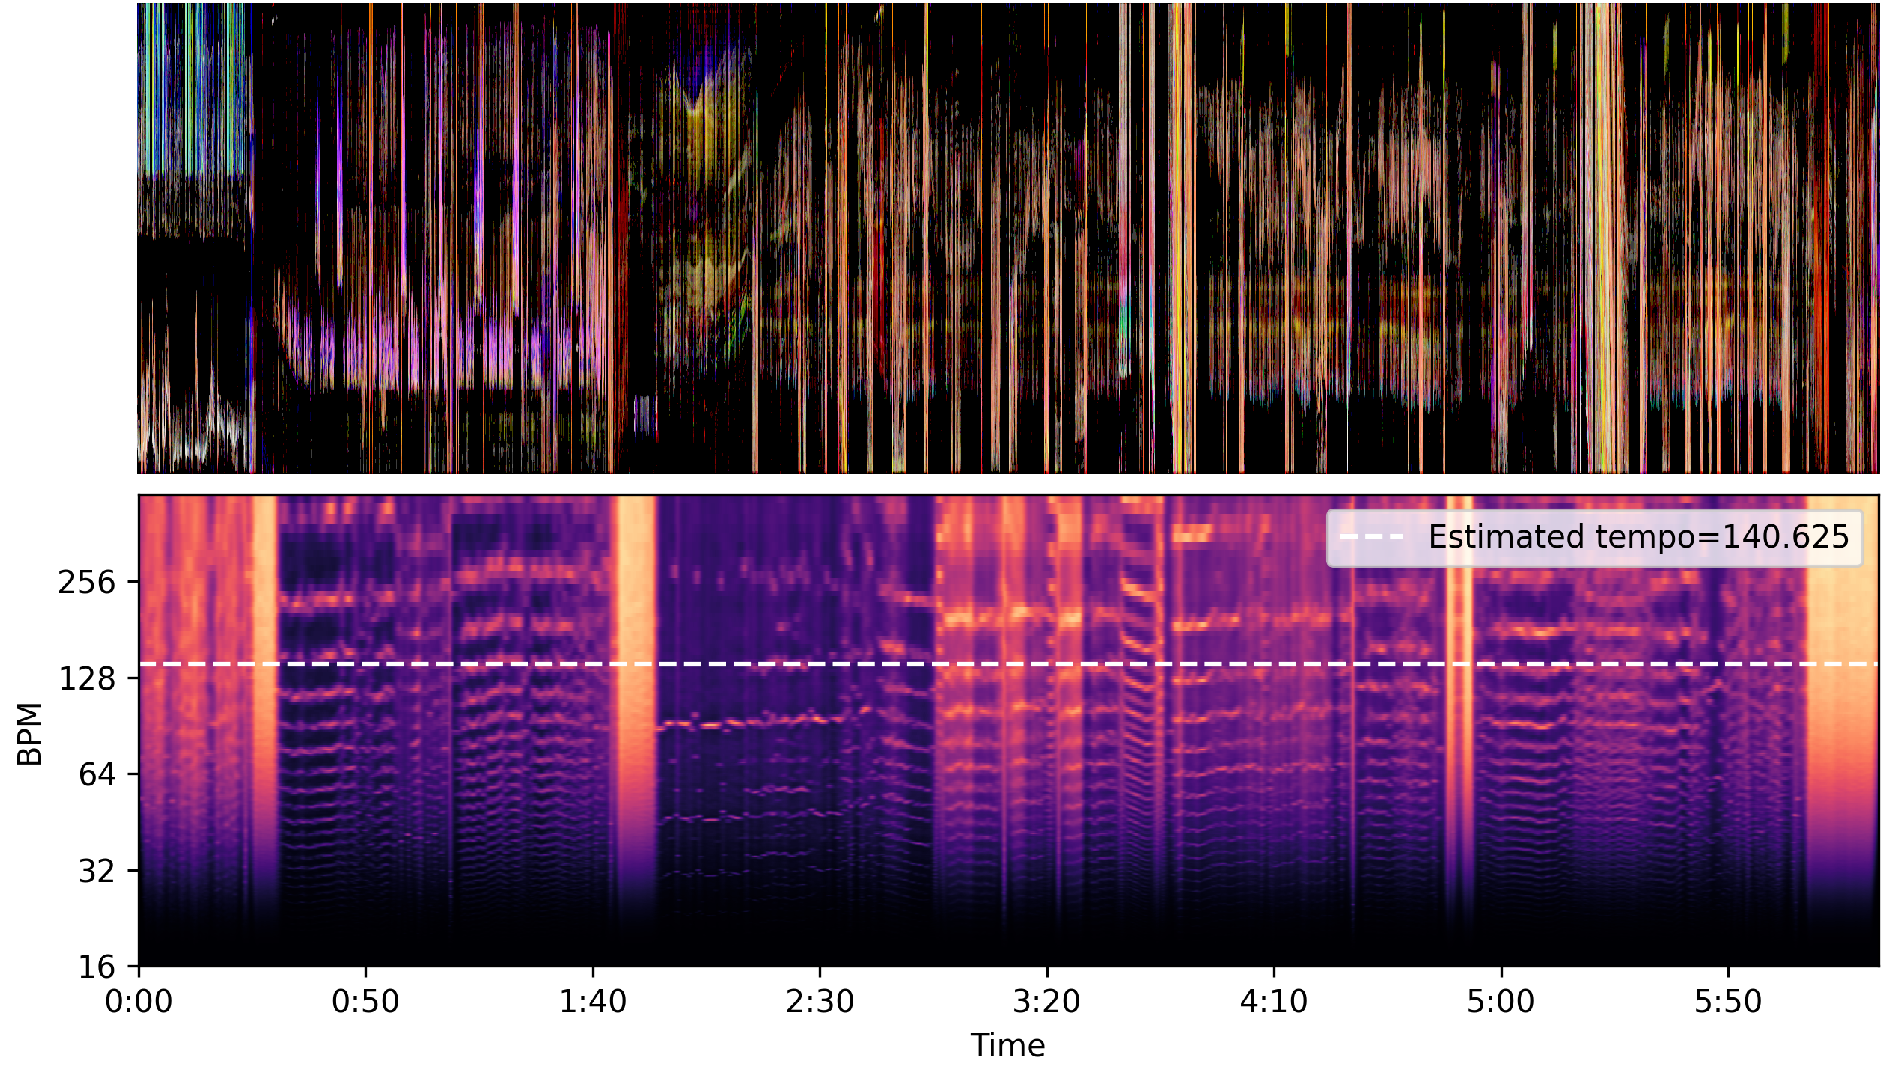
The motiongram can also be used together with audio representations, such as the tempogram shown below.
Grid representations
The above visualizations show information about continuous motion. I often find this to be useful when studying, well, motion. However, when dealing with multi-camera productions, it is often common to look at grid-based image displays instead. Using one of the functions from the MGT for Terminal, I created some versions with an increasing number of extracted frames.
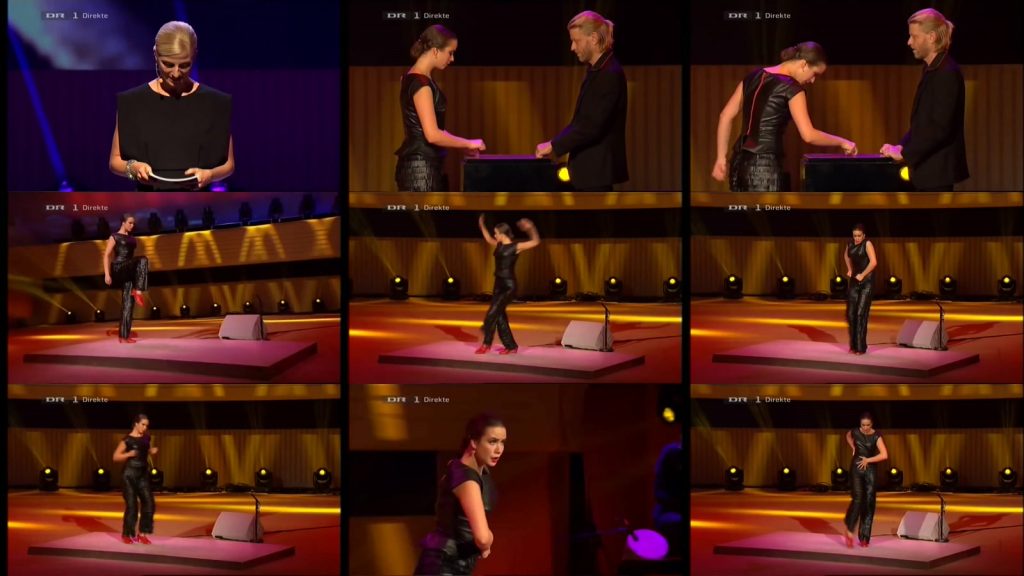
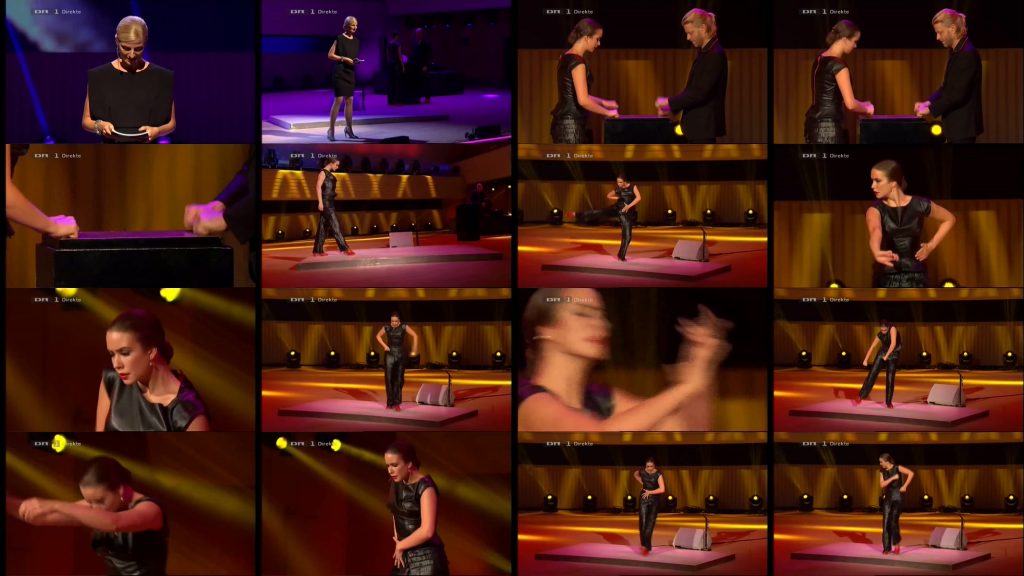
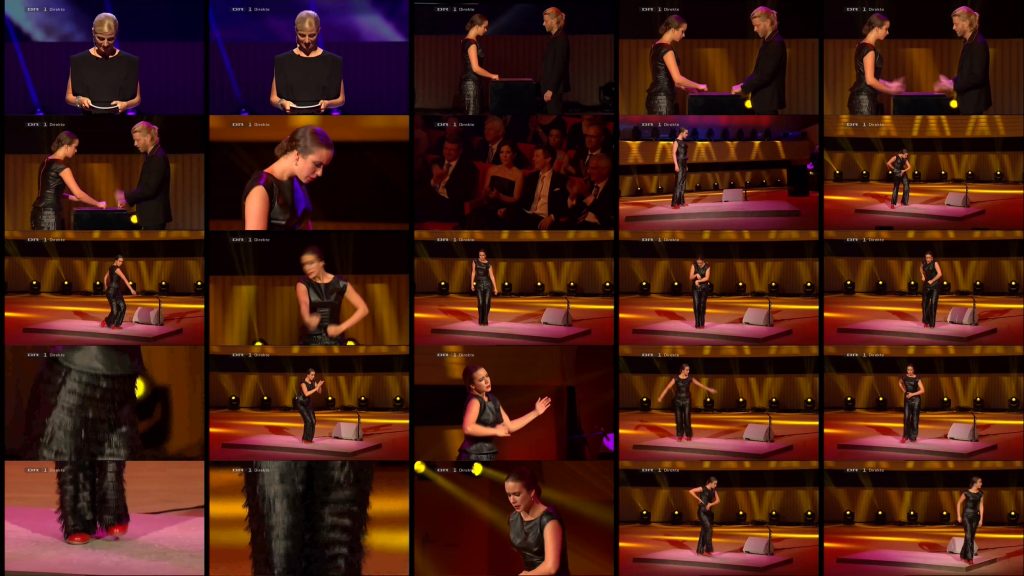
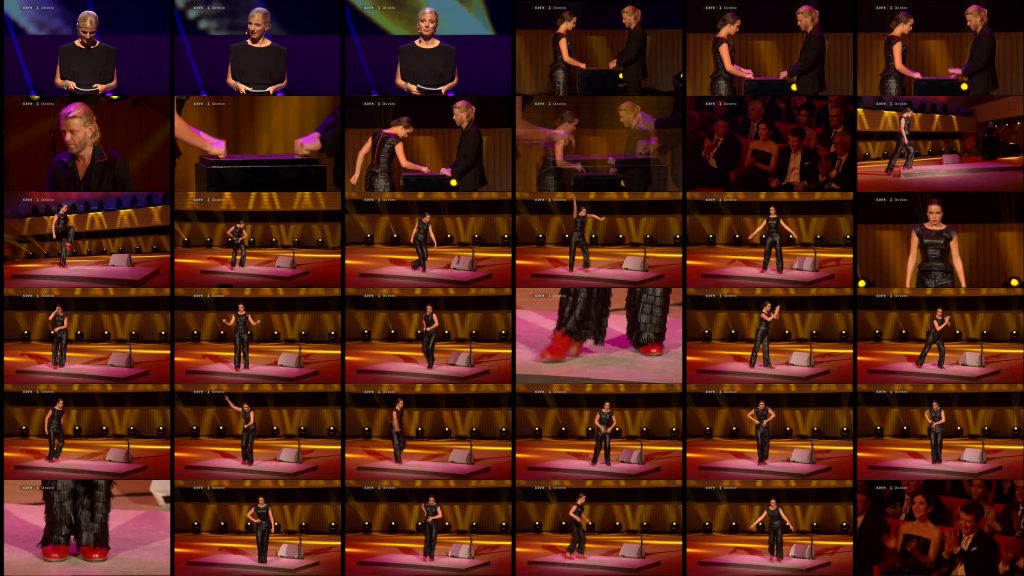
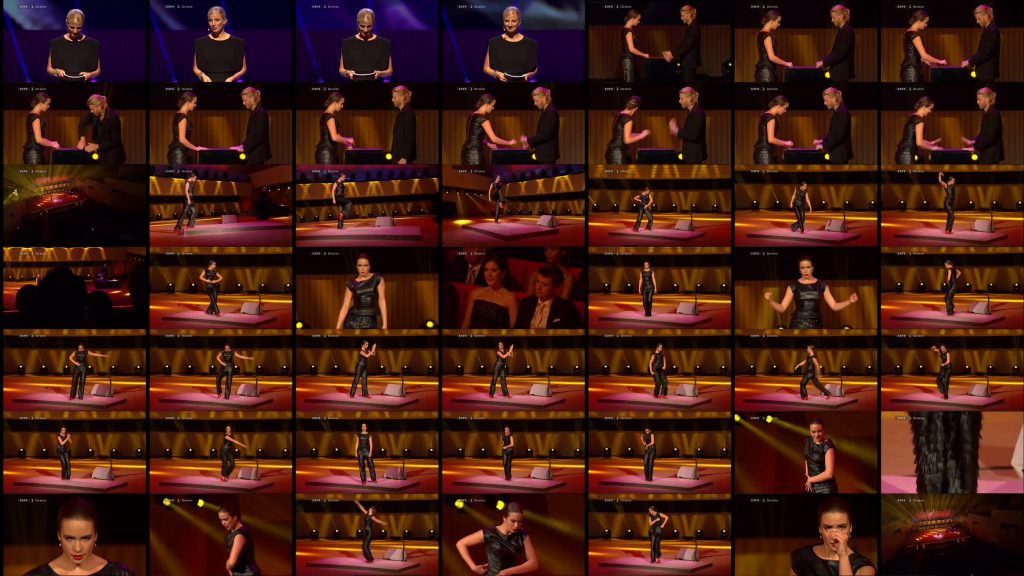
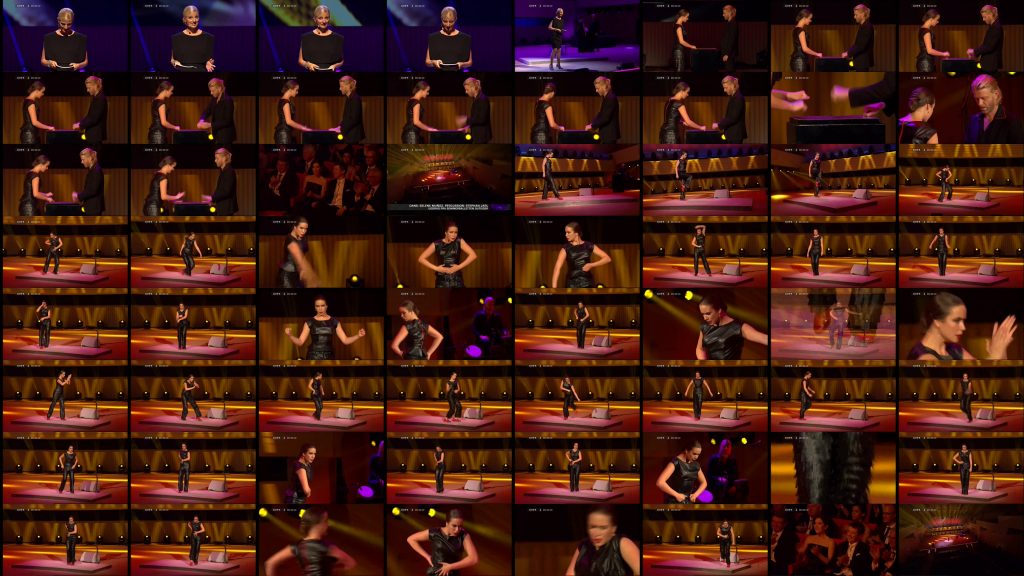
There is a trade-off here between getting a general overview and getting into the details. I think that the 3x3 and 4x4 versions manage to capture the main content of the recording fairly well.
Visualizations always need to be targeted at what one wants to show. Often, it may be the combination of different plots that is most useful. For example, a grid display may be used together with motiongrams and a waveform of the audio.
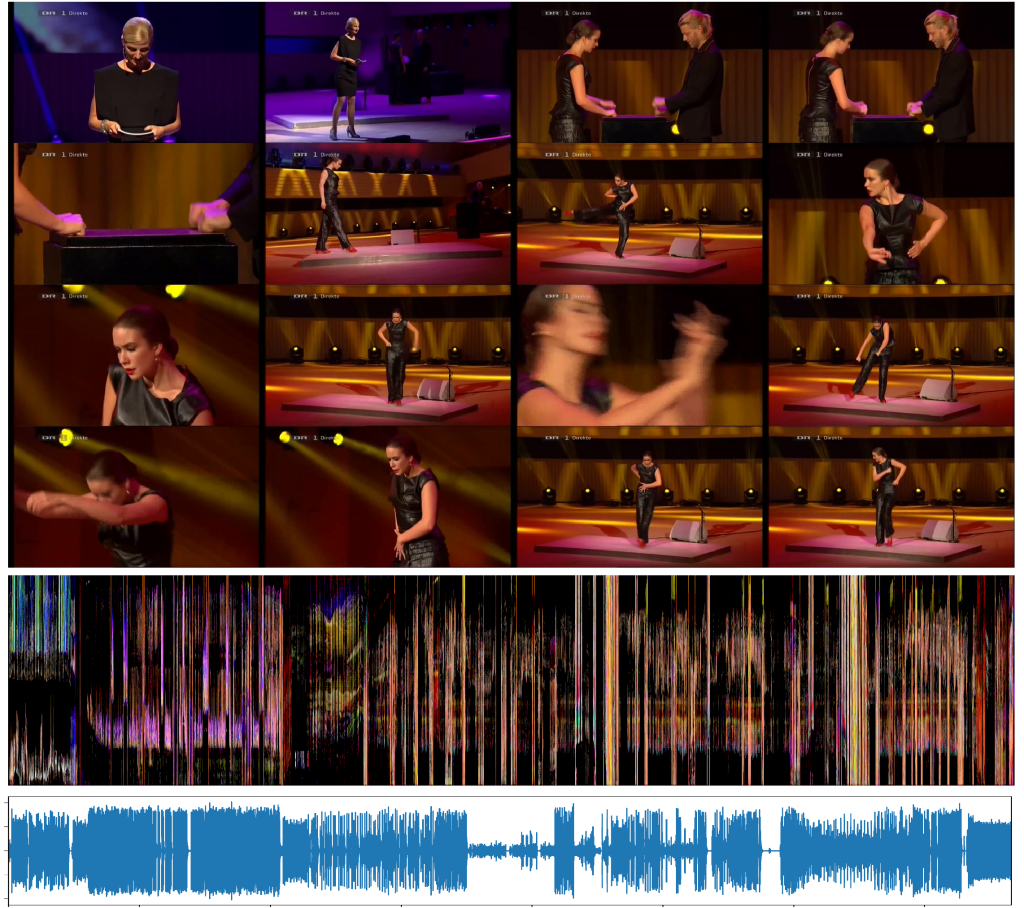
Now I put these displays together manually. The aim is to generate such combined plots directly from MGT for Python.